What is Mapper?
Understanding of mapper from the ground up.
As one of the main tools from the field of Topological Data Analysis, Mapper has been shown to be particularly useful for exploring high dimensional point cloud data. This post will walk through the mapper construction from an intuitive perspective and demonstrate how it can be constructed on a toy example.
Motivation
Mapper is way to construct a graph (or simplicial complex) from data in a way that reveals the some of the topological features of the space. Though not exact, Mapper is able to estimate important connectivity aspects of the underlying space of the data so that it can be explored in a visual forum. This is an unsupervised method of generating a visual representation of the data that can often reveal new insights of the data that other methods cannot. Most importantly, once constructed Mapper can be used by nonexperts to explore the structure of a data set or function on the data.
Mapper fundamentals
As with many concepts from data science, Mapper can be viewed from two perspectives, one very informal and one very mathematical. The formal definition of mapper is a simplicial complex constructed by taking the nerve of the refined pullback of an overlapping cover of a lens function. This definition boils down to simply splitting up the data points into buckets, clustering the points within each bucket, and then stringing the clusters together into a graph.
To construct the mapper, we need to define two pieces
- a lens
- a cover of the lens
The lens is a function through which we observe the data. It is a summarization of your data in a much lower dimensional space. If you are looking at 3D images, the lens function might be the height, or y-axis of the data. If your data is extremely high dimensional, your lens might be a low dimensional representation constructed with UMAP or PCA, or a variable you are particularly concerned about.
An illustration
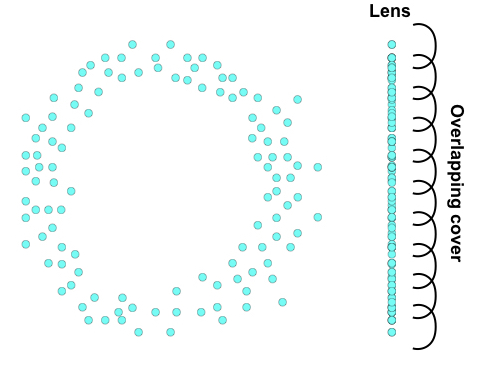
Suppose we have some 2-dimensional data shown below. A priori we might not realize it was sampled on some sort of circle. As a lens, we have have chosen the y-axis (or height of the data points). We define a cover of the lens to be 10 intervals with about 20% overlap. The lens and cover are shown below.
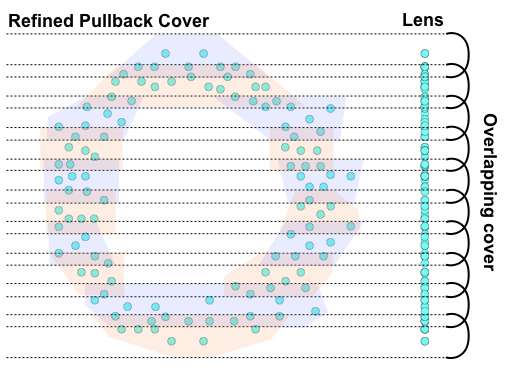
To compute the refined pullback cover of our data, we need to pull each of the cover elements back into our original space. In practice, this amounts to tracking the indices of data points in each cover element. To refine the pullback cover, we apply a clustering algorithm to the original high dimensional data, but to only the points within a cover element. In this case, we would apply a clustering algorithm to each of the 10 groups of points. In the case below, the first cover element has only one cluster, while the 3rd cover element has two clusters. Notice that because the original cover was overlapping, some of these clusters have data points in common.
The final step is to compute the nerve of these clusters. The nerve of a cover is a simplicial complex such that each cover element becomes a vertex and every time two or more cover elements intersect, their vertices are connected. Below we show the nerve constructed from our refined pullback cover.
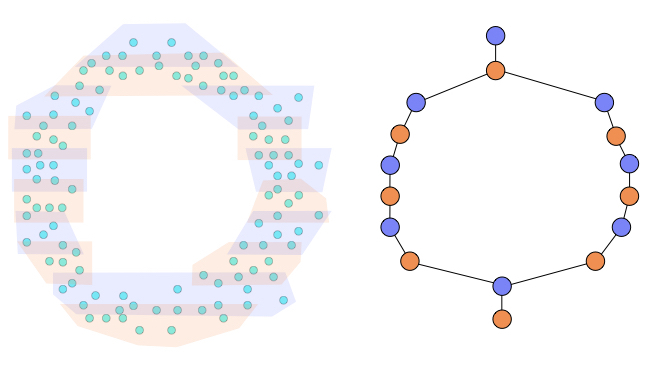
The result is a graph (or simplicial complex) that captures the structure of the original data with respect to our lens. From the noisy data that was obviously drawn from a circle, we constructed a graph that represents one big circle. If we did not know the data was sampled from the circle, we do now.
If you want to get your hands dirty with some real data, checkout KeplerMapper. It makes it easy to define lenses and covers and to visualize and explore the resulting Mapper.
Share this post
Twitter
Google+
Facebook
Reddit
LinkedIn
StumbleUpon
Pinterest
Email